Today is pretty much a mega-update. There are a lot of pieces of news that we think are important that we are going to cover today.
There are some things we are going to skip as well. US numbers today, TN numbers today. We want at least another day’s worth of data before presenting again.
Where are we on the curve?
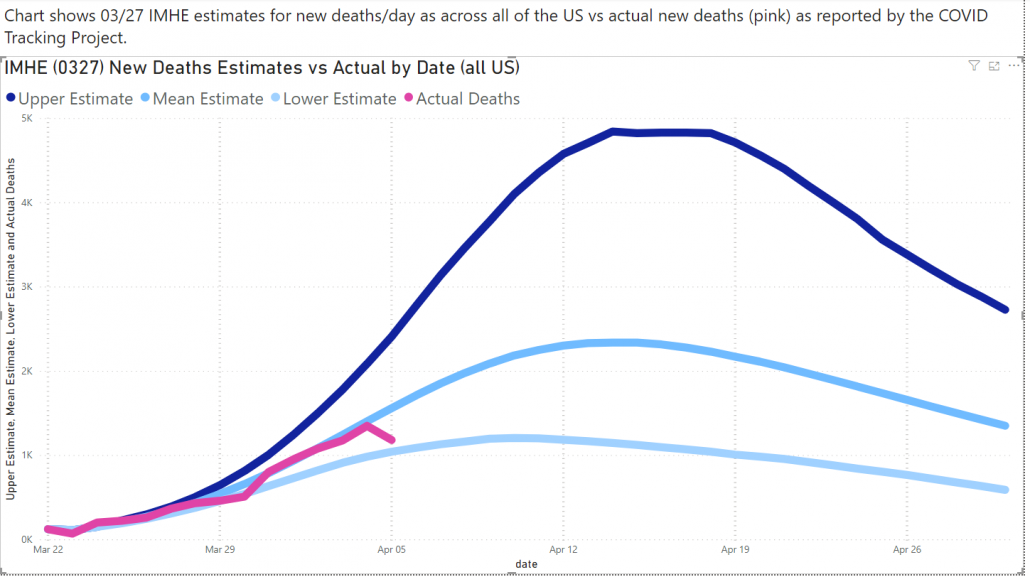
About 10 days to peak (US whole) and new deaths per day coming in under the average estimate from IHME’s 03/27 projections. That is a good thing.
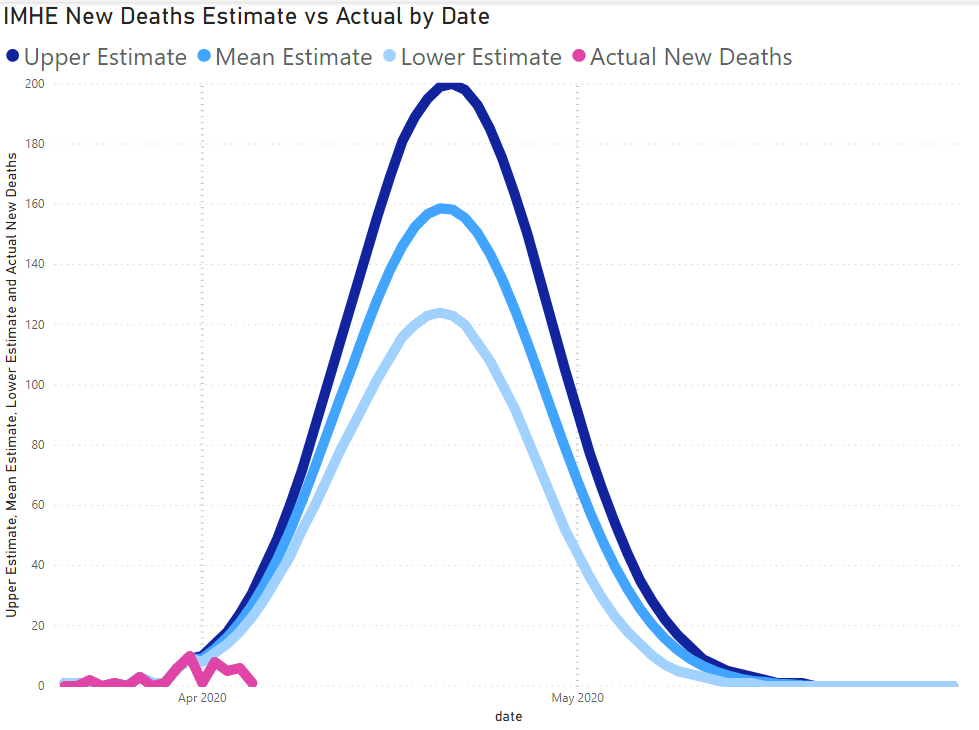
Tenessee is actually coming in well under the lower estimate. (Note, this model is newer than not he one in the previous graph).
That is, of course, mostly great news! We don’t want more deaths!
The question, of course, is why are we so far off the model? Did we social distance that well? (no). Is the model faulty at the state level? (maybe) Is our data on deaths off? (see below, maybe)
The uncertainty is especially problematic because it gives our policymakers (Lee, Jacobs, Kincannon, et. al.) less confidence in the data and projections they need to use to make useful decisions.
To JM Addington it also belays another point we’ve made: the data suggests that different localities are going to have very different experiences. To be transparent, we haven’t found an expert who shares our view. However, the data clearly indicates that Knoxville is not like Nasvhille is not like New York is not like Hong Kong.
Bill Gates thinks that the US death toll will probably come in under the White House’s 100,000 – 240,000 estimate, as long as the US continues to social distance. It is really important to realize that this is a direct trade-off, cut-off social distancing and the cases & deaths will rise. He rightly notes in this interview that what we do with tests matter more than the absolutely number. The US isn’t doing what it needs to be doing.
In a separate op-ed Gates expresses that he still thinks we have 10 weeks of social distancing left because we didn’t implement it correctly the first time. It’s worth the read if you have time.
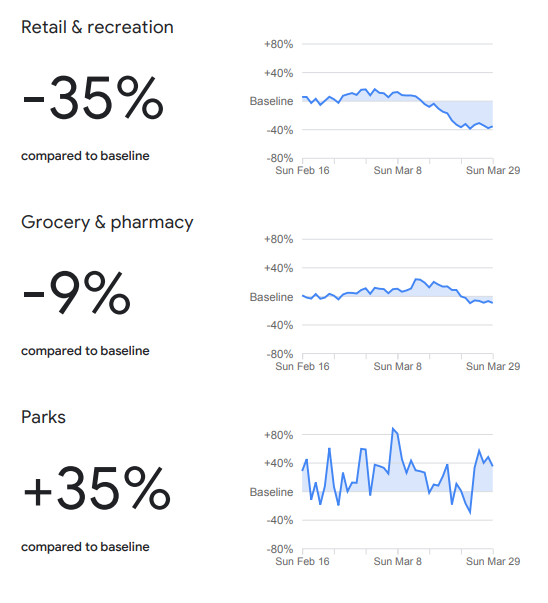
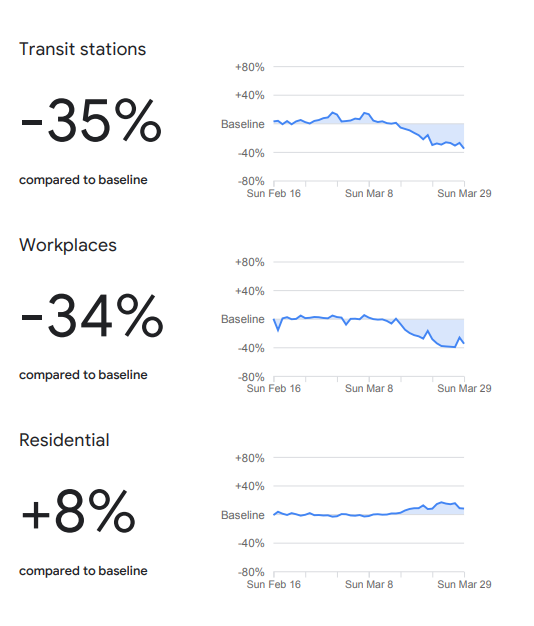
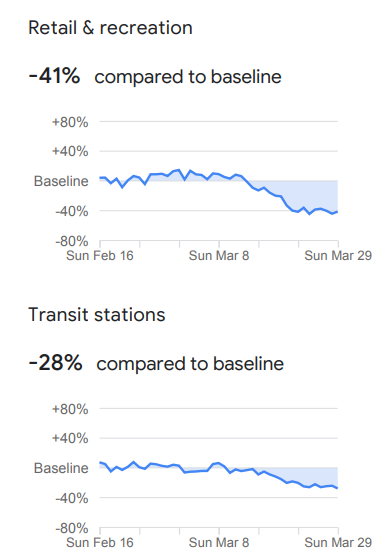
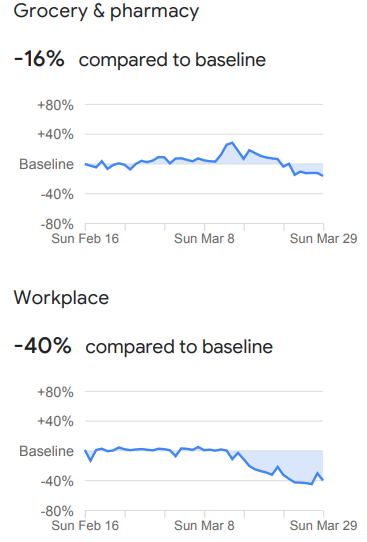
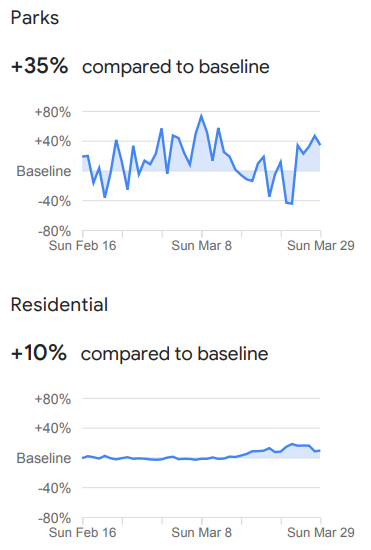
Google has published a portal showing how different countries, states, and counties are practicing social distancing. It is likely that Google has the best data in the world on this. Tennessee’s numbers (below) line up with data from Unacast.
Knox County looks close to the same:
The reports are really easy to find, download and understand if you want to look up your city/county/state. So what? Early data indicates that there is about a two lag between implementing social distancing and seeing growth slow down. The data from Google and Unacast give us dates that people actually stopped going out, not just when the orders were handed down. For Knoxville, that date appears to be about March 20th.
We’ve talked a few times here about the importance of when we social distance and stop the case/death growth rate. On March 15th TN only had 7 new COVID-19 cases, on March 29th it was 164 new cases. We could have “flattened the curve” by implementing social distancing earlier on. At JM Addington — and thousands of other businesses around the state — this is especially important because the more cases we have the harder the economic impact will be.
Social distancing has already had an impact on our business and we think it will continue to have one. At the same time, we expect the virus to dictate the economic and policy outcomes. People are not going to rush back to theaters, restaurants, doctors’ offices, recreational activities, retail so long as there is the perception that it is or could be dangerous. Any state in the Union under lockdown could lift it today and lots of people are still going to stay home.
The piece that matters for both economic and medical healing is getting COVID-19 under control. And right now, social distancing is the most effective tool we have.
Does Social Distancing Work?
Short version: yes. Candidly, first, the physics of it work out really easily, if sick people aren’t close to well people they can’t infect them.
Second, all the experts we can find on record agree that it makes a real difference.
A couple of weeks ago we put out some simple exponential regressions showing how the US and TN were likely to increase in cases. They were not and are epidemiological models and you shouldn’t take them that way for a million reasons. However, they have an advantage in that there are no assumptions built in, just data.
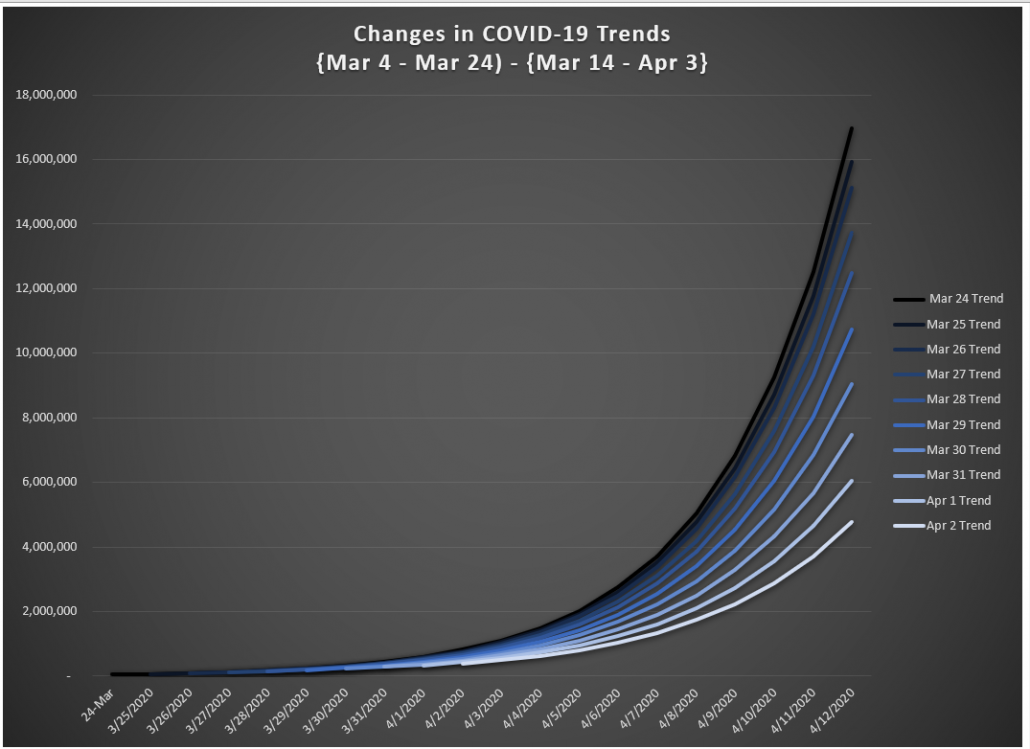
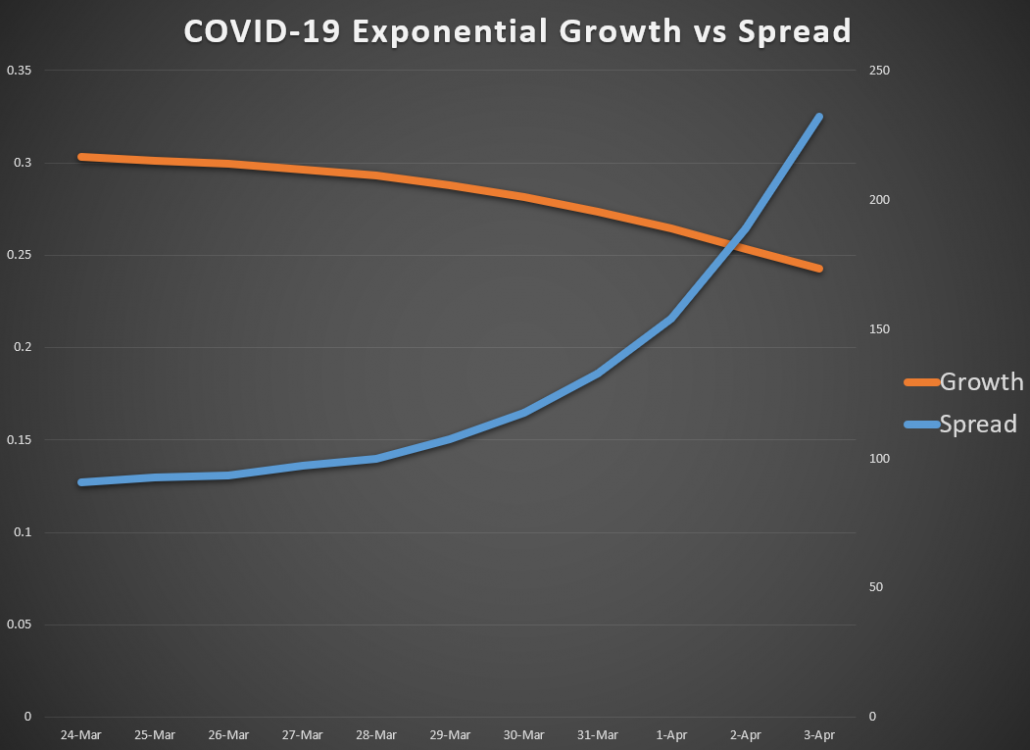
Here are 10 regressions plotted on top of one another, the first has 21 days of data from March 4 through March 24, the second from March 5 through 25, and so on. Each regression continues past its end date to April the 12th.
It’s ok if the results aren’t clear to you. Before social distancing kicks in, the first trend shows over 16,000,000 million COVID-19 cases by April 12th. By the end regression, there are less than 5,000,000. For a bunch of reasons we don’t expect to see 5,000,000 cases in the next 7 days, the point is that even simple mathematical models can and do show the immediate impact of social distancing. You can repeat this using public data in your own copy of Excel if you desire. [1]
We can present it another way: while the absolute number of cases increases, the growth rate is decreasing. I.e., the speed at which COVID-19 is getting worse is slowing down.
The foot is easing off the accelerator. But at 120mph it still takes a minute to see the speedometer decrease.
Data Pains
In the last couple days there has been reporting of Italy significantly under-counting deaths from COVID-19, especially those that occur in nursing homes. The Washington Post has a similar article for the US. In the United States there is not a standard on how post-mortem testing.
The New York Times and Radio Free Asia both have articles that say China substantially under-reported cases and deaths in Wuhan. To be clear, sources from these two articles would be biased.
However, the implication for the rest of the world is that China’s 3.4% rate could be low, meaning that the number we thought was the worst-case scenario is higher.
Our view, is that for Western countries there is enough reliable data to come to our estimates. For the developing world, however, this is bad news.
The American intelligence about understated numbers predates recent reporting in the Chinese news media that the death count in Wuhan could be 5,000 or more, double the official number.
The New York Times
Social media users have been doing some basic math to figure out their daily capacity, while the news website Caixin.com reported that 5,000 urns had been delivered by a supplier to the Hankou Funeral Home in one day alone — double the official number of deaths.
Radio Free Asia
Long Term Care Facilities
WVLT ran a story late Thursday that 29 patients, 16 employees test positive for COVID-19 at a Cookeville long-term care facility. Minnesota, which has been very transparent in its COVID-19 handling, is reporting at least 30 longterm care facilities that have one or more cases. There have been some horrific news stories out of Italy and Spain around COVID-19 getting into nursing homes, to see the same in the US would be tragic.
Financial
TurboTax has created a portal to help you get your stimulus payments. Keep in mind that for most people that this will be a director deposit and not a check. The direct deposits are also likely to hit your account much faster than paper checks. Most Americans won’t need this service, including anyone who filed for 2018 or 2019 already. If you aren’t sure contact an accountant.
The PPP loans — the loans to be forgiven if used for payroll — are slow to roll out, where they are rolling out at all. As of Friday afternoon, the day they officially became available only $9b of the $350b had been applied for. JM Addington received two emails from our bank over the weekend basically asking for patience and stating that they were doing all that they could do.
We haven’t heard anything about the EIDL (disaster, 7b) loan we applied for since putting in our application. Nothing has popped up in our news feed and we don’t know anyone that has gotten it so far either.
Again, for reference, the last year we have data for the SBA processed 47,000 7a loans (the same type the PPP fall under). Presumably, any disaster loans issued were for “typical” disasters. There isn’t hard data on the total applications, but the US has over 30,000,000 small businesses. We assume that most of them will apply, dwarfing previous years. We expect that (1) the SBA and their partner banks will be completely overwhelmed by this, and (2) businesses that survive an interim shortage of cash need to find sources of capital on their own.
If you or your employer is using other funding sources we highly recommend that you get with an accountant to figure out how to track it as payroll-related so that when the PPP comes through it still counts as forgivable. Strategic, bold moves at this phase will pay long term dividends.
International Numbers
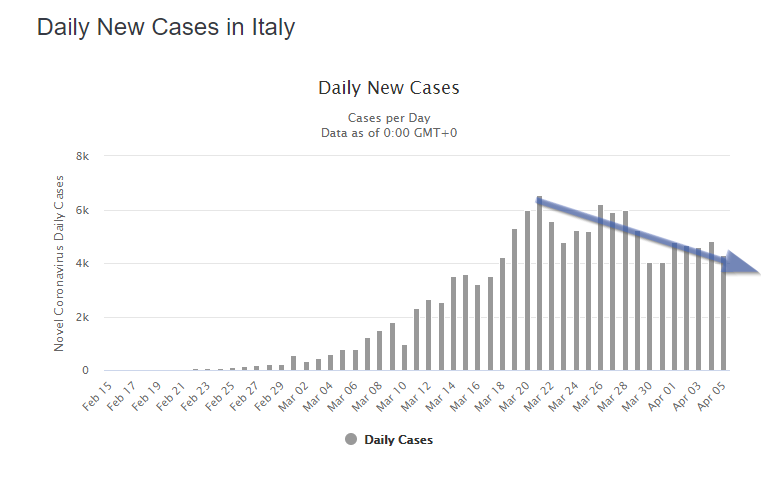
Italy is moving in the right direction. To us, this is more significant than other European countries because (1) Italy was hardest it, if they can make the right progress we all can, (2) they didn’t social distance well at first, which candidly reflects the US, and (3) they have a more vulnerable population than most countries.
How JM Addington is Adjusting
Financially it is becoming more apparent that we need to be self-reliant on capital in the short-term. While the EIDL and PPP loans may come through we aren’t planning on them to come through when we need the cash and we are creating other plans to cover potential shortfalls over that period.
Masks: we’ve ordered enough fabric and elastic to make enough masks for each employee to have at least two, one for wearing and one that can be washed.
The South China Morning Post in Hong Kong ran an “I told you so,” article on the mask topic. And, well, they did tell the world so. Hong Kong still has fewer cases than Idaho.
Your author has been wearing a fabric mask while in stores for the last two weeks. The goal is mitigation of risk not elimination of risk. Just like washing hands won’t guarantee anything it helps and its easy.
Other
Thanks to those that have shared kind words or liked these posts. We’re doing out best to put out data-driven analysis, each one of these takes about 2 hours. It’s helpful to know that they are being read.
If you want copies of the Excel sheet and PowerBI Reports we use to put these together email us, info@jmaddington.com. Right now, our PowerBI combines data from JHU, NYT, COVID Tracking Project, IMHE and the TN Department of Health. Most sets are updated daily.
[1] Major thanks to Matt Enlow for helping us through the math and Tim Bubar for getting us in touch.
Download our Report!
Get your copy of What Every Business Owner Must Know About Hiring an Honest, Competent, Responsive, and Fairly-Priced Computer Consultant.

